República de Moçambique
Labour Market Skills Intelligence
Horizon · live demo
MT

Overview

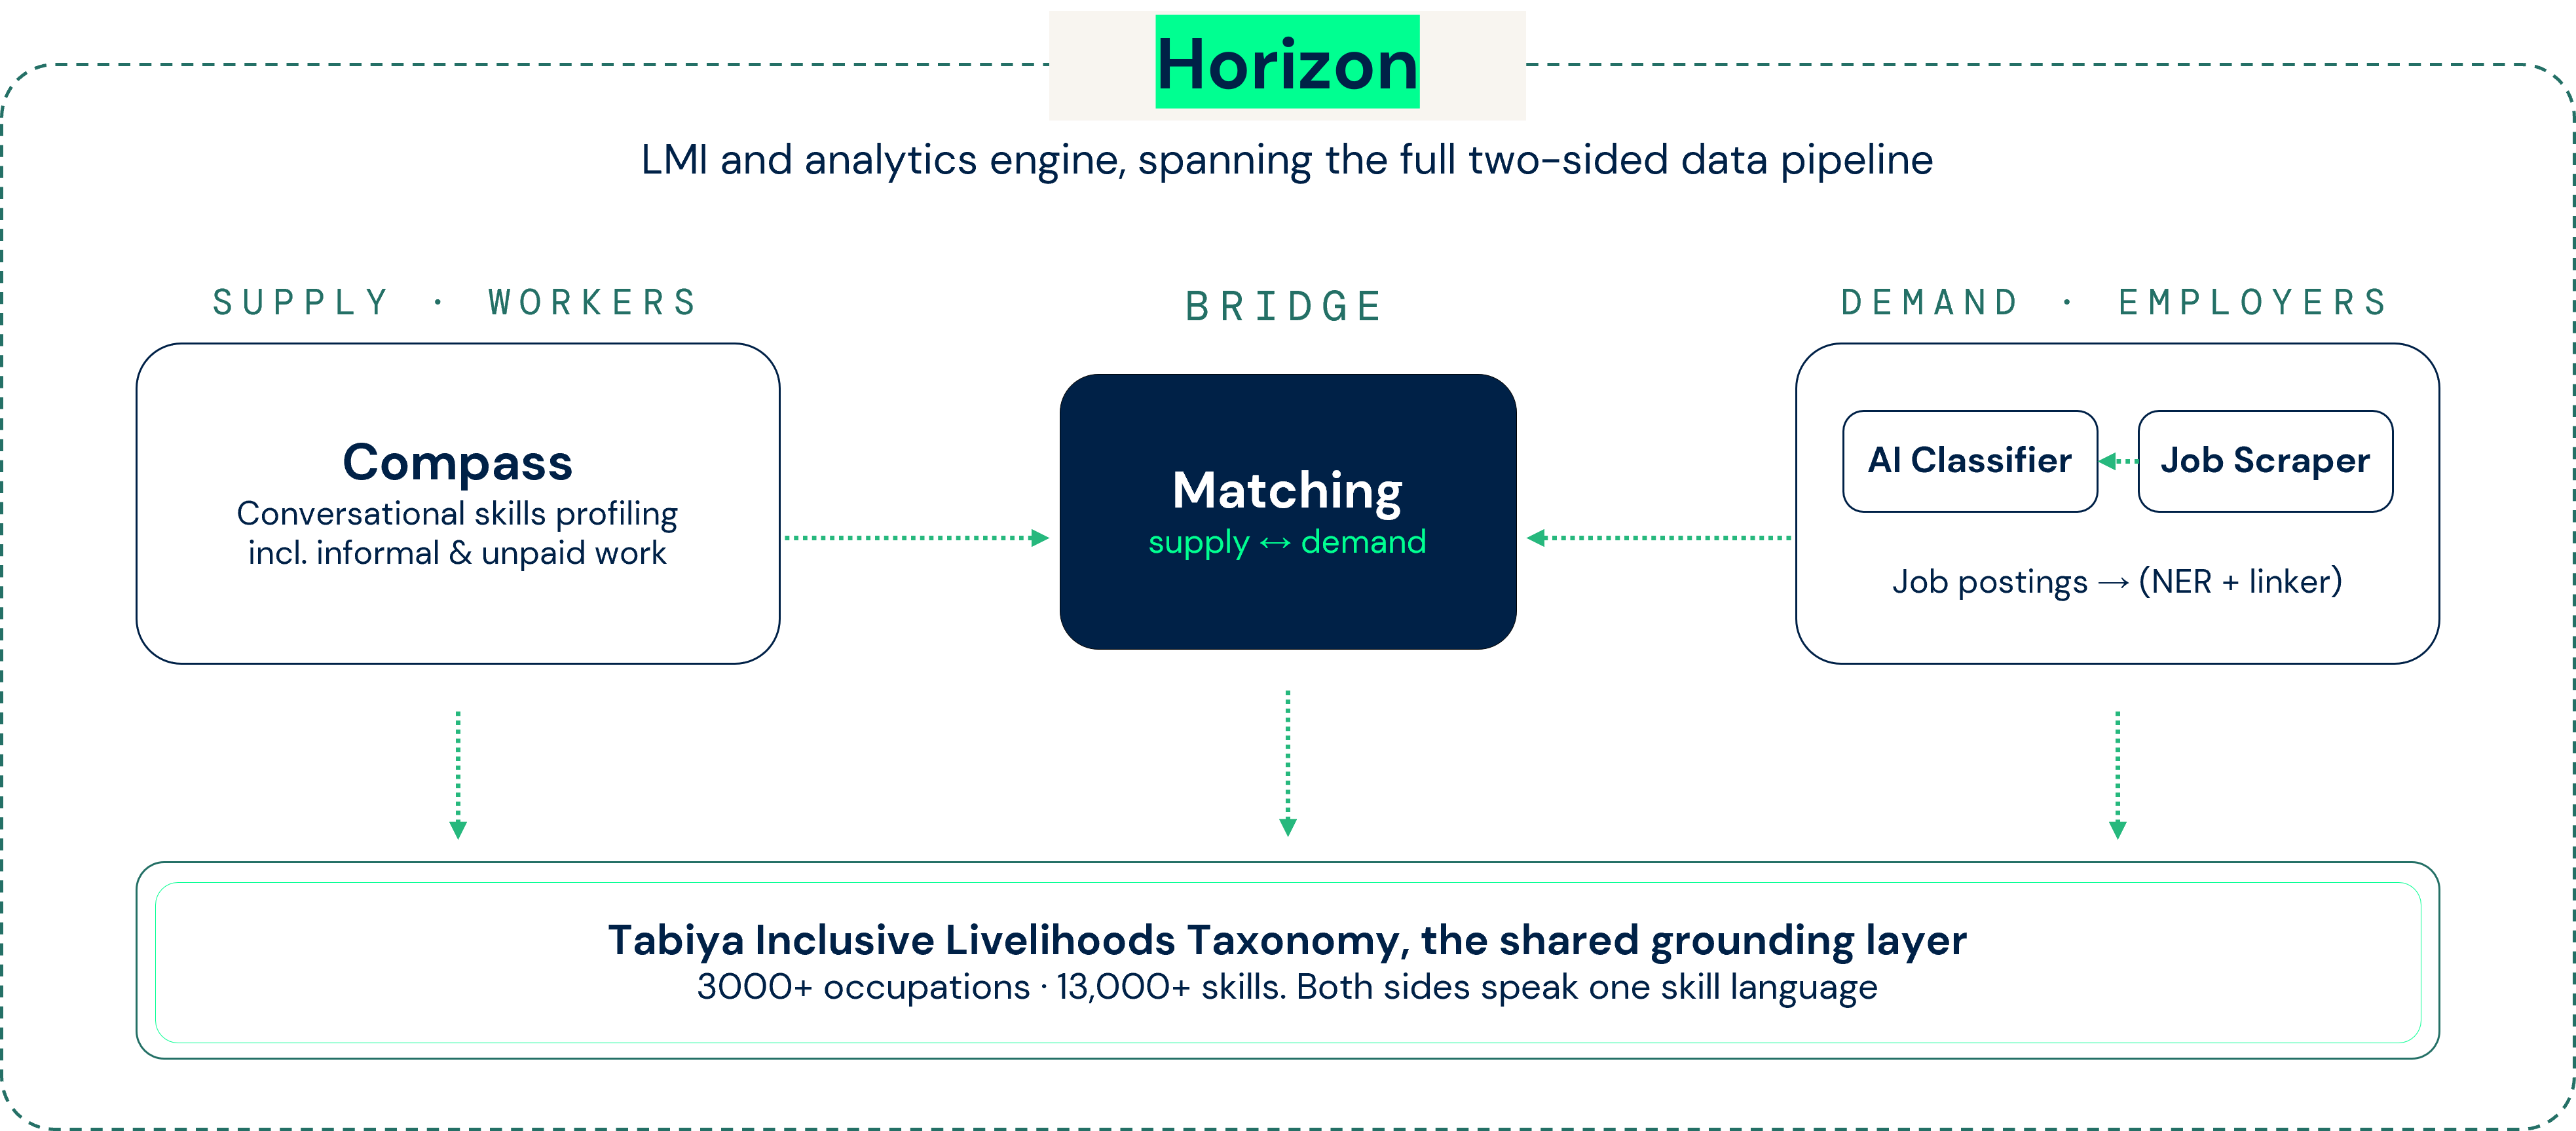
An occupation and skills overview of Mozambique's labour market. It draws on four data sources: jobseekers served on the platform (talent pool), vacancies aggregated and classified on the platform (labour demand), and national statistics describing the labour force and the economic structure. Skills on both sides are classified against the Tabiya taxonomy, allowing supply and demand to be compared on a common vocabulary.

Horizon architecture: Compass (supply) and AI Classifier / Job Scraper (demand), bridged by Matching, grounded on the Tabiya Inclusive Livelihoods Taxonomy, complemented by national data.
Data sources
Talent poolJobseekers served on the platform
VacanciesJob postings aggregated on the platform
National data iLabour force and economic statistics
TaxonomyTabiya skills classification
Jobseekers served
14,200
Talent pool
Vacancies classified
1,180
per week Vacancies
Sectors observed
7
supply and demand
Provinces observed
11
national coverage
Distribution of work type
Share of each work type among jobseekers served and across the national labour force
Status in employment
Composition of advertised vacancies compared with the economy's actual employment structure
Educational attainment and requirements
Highest level attained by jobseekers and by the labour force, set against the level required in vacancies
Years of work experience
Experience held by jobseekers and by the labour force, set against the experience required in vacancies
Skill clusters in the talent pool
Ten most common skills clusters observed among jobseekers served
Skill clusters in advertised demand
Ten most demanded skill clusters across classified vacancies

Skills Atlas

What the workforce can actually do — specialised skills profiled from real people via Compass and mapped to the Tabiya taxonomy. Transversal "soft" skills are excluded so the sectoral, technical base of the labour force is what shows through.

Data sources
Talent poolJobseekers profiled on Compass
TaxonomySkill structure & roll-ups
National data iPopulation & higher-education figures
Specialised skills in the talent pool
Share of the whole talent pool holding each group · hover a bar for its skills
Each skill also carries a Compass proficiency score (0–1); bars show prevalence — the share of the pool holding the skill.
Talent-pool composition
Skill-cluster mix, split by gender · hover for top skills
Skills by reuse level
How transferable the pool's skills are. Transversal and cross-sector skills move between jobs; occupation-specific skills do not. Uses the taxonomy reuse-level attribute.
Where the pool's skills come from
Share of skills acquired via a study programme vs work experience, by education level — Compass records each skill's origin
"From study programme" is what formal education contributes to the skill base. Mapping those skills to specific disciplines (engineering, health…) needs national higher-education data.
Why this matters: knowing the specialised-skill base of each group — by sector, by gender and education, and which tertiary disciplines feed it — not just years of schooling, is what tells a training ministry where a short certification can unlock a shortage occupation.

Employer Demand

Live signals from Mozambique's advertised labour market. Postings are scraped from job boards, company sites and the public employment portal, then classified to ESCO. These measure advertised demand flow — not hires, which scraped postings cannot observe.

Data sources
VacanciesJob postings scraped & classified to ESCO
TaxonomySkill structure & categories
National data iSector economy share & totals
Postings this week
1,180
From 7 sources ↑ 11%
Avg postings / week
1,060
Rolling 12-month baseline
Unique skills detected
4,900
of 13,000+ in the taxonomy
Active alerts
2
Posting anomalies
Vacancies by sector
Demand share · last 7 days vs. sector share of the economy
Vacancies demand share · National data i economy share (sector GVA). The gap between the two polygons shows where advertised demand over- or under-represents the real economy.
Job sources by occupation type
Postings per source, split by ISCO major group — different boards carry different job types
Top skill clusters in demand
Across all sectors
★ marks a national-priority sector.
Sector demand concentration across provinces
Share of each province's postings, by sector
Posting volume & market signals by sector
Average weekly flow, 30-day momentum, seasonal peak and the latest demand signal per sector
SectorPostings / wk30-daySeasonal peakLatest signal
★ Agriculture & Agro-processing155→ 2%Oct & Apr–Jun · plant/harvestUpdate Agro-processing recruitment steady · Zambézia 2d
Construction & Infrastructure180↑ 7%Apr–Oct · dry seasonCritical Crane & heavy-equipment operator gap widening 1d
★ Extractives & Energy360↑ 18%Rising — LNG rampSpike LNG construction skills surge · Cabo Delgado 2h
Fisheries & Blue Economy60↑ 5%Mar–Sep · open season
Tourism & Hospitality130↑ 12%May–Oct + DecNew Coastal tourism reopening · Inhambane & Bazaruto 8h
Trade & Services80→ 1%Nov–Dec · year-end
★ Transport & Logistics215↑ 9%May–Jul · harvest exportsNew Port & logistics hiring up · Nacala corridor 5h
★ national-priority sector.

Intelligence & Action

Where the talent pool meets — or misses — advertised demand, read at the level of specific skills and the matcher's per-worker gap recommendations. Figures are descriptive signals from platform data.

Candidate–vacancy matches analysed
184,000
Matching pairs scored
Vacancies with a qualified candidate
1,040
≈88% of open vacancies · ≥1 strong match
Workers meeting essential skills
10,800
clear a vacancy's must-have skills · ≈76%
Candidates with a strong skills match
8,100
≈57% of the pool
Essential-skill fit across the workforce
Mean essential_fit — how much of an opening's must-have skills the pool covers, by workforce level (ISCO group)
Lower bars = openings where the pool covers least of the must-have skill set.
Forecast-priority skills: demand & pool coverage
Skills flagged as future priorities in sector workforce forecasts — current vacancy demand, and how much of the talent pool already holds each skill or a related one
Skill · sectorIn vacancies nowPool has itPool has related skills
Cells are flagged where the pool barely holds a forecast-priority skill.
Skill clusters → demand sectors
Talent-pool skill clusters mapped onto the sectors that demand them — flow = matched workers. Select a sector to drill into its specific skills & sub-sectors.
Sector training & demand signals
Programme enrolment, forecast growth and current vacancy demand, by sector
Enrolment & forecast growth are national-data placeholders; vacancy demand is from classified postings.
Within-sector skill mismatch for priority sectors
Sectors where the talent pool already holds the relevant occupations but lacks the specific skills demand now requires. The matcher's skill-gap recommendations rank the essential skills the sector's pool most often misses.
Skill profile — pool vs. demand · Extractives & Energy
Top 5 demanded skill shortfalls
Workers = sector-pool members for whom the skill is a top gap recommendation (Matching skill_gap_recommendations, counted across the sector pool).